State‑Level Spatial Analysis of Shooting Incidents in the United States
Agenda
- Introduction
- Data extraction and exploration
- Analysis
- Results
- Discussion
Introduction
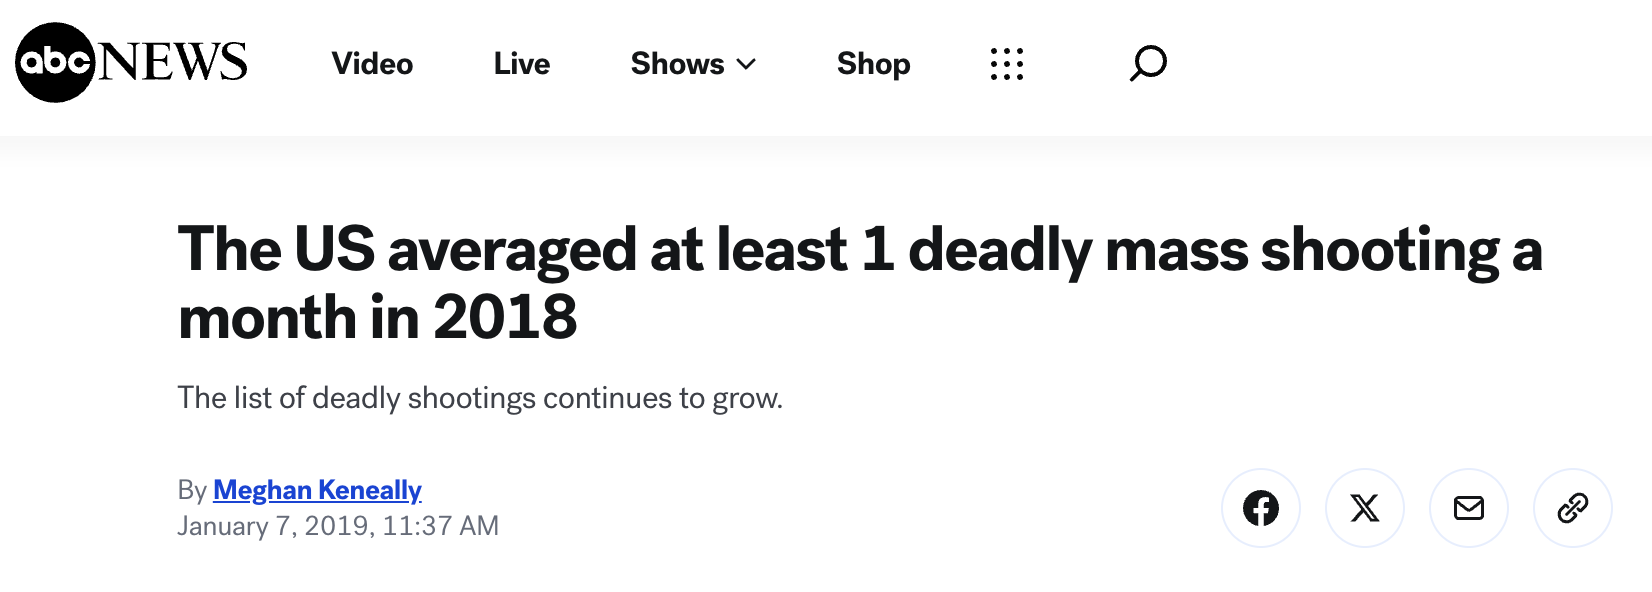
Gun Violence as a Public Health Crisis
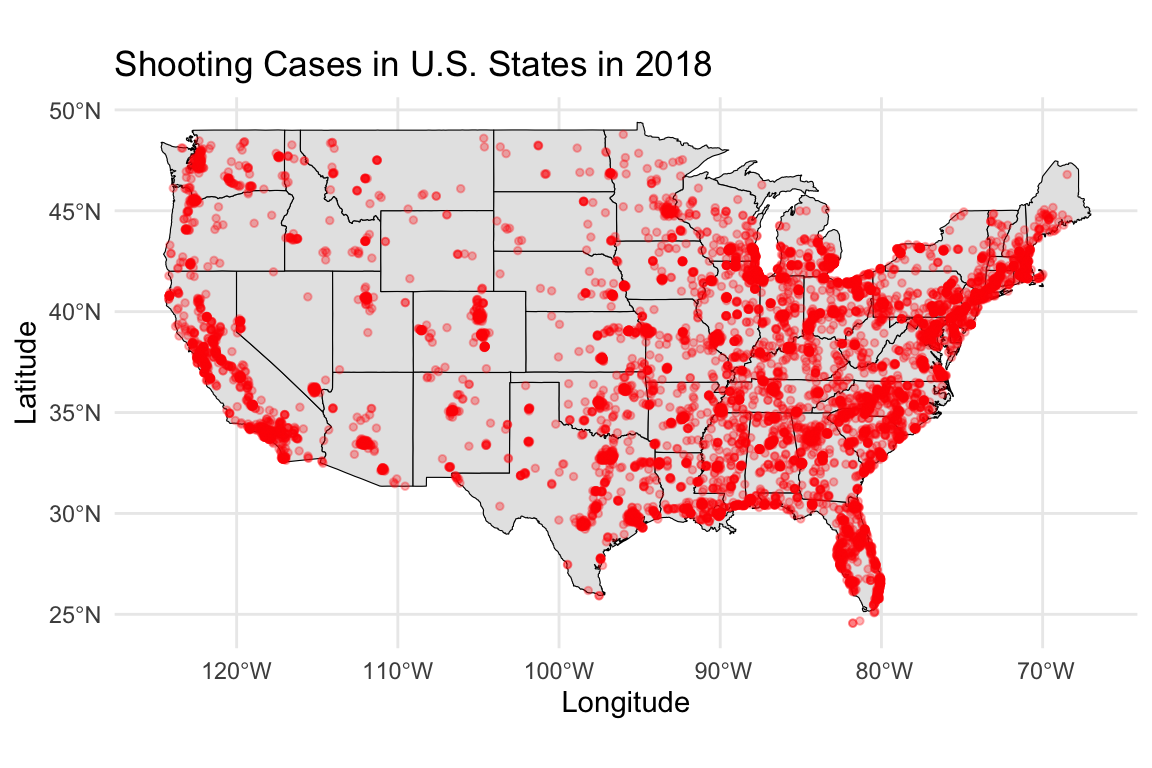
- In 2018, the U.S. saw over 39,000 gun-related deaths.
- Gun violence is now the leading cause of death for children and teens.
- Community shootings often occur in spatial clusters, not in isolation.
Introduction
Unequal Burden Across States
- States differ widely in gun laws, social conditions, and urbanization.
- These differences result in substantial variation in shooting rates.
- Some regions experience persistently elevated risks, even when adjusting for population size.
Introduction
- Our goal is to uncover geographic patterns and influential predictors of shooting incidents across U.S. states in 2018.
Why It Matters
- Helps guide state-level policy interventions.
- Equips public health leaders with data for resource targeting.
- Supports equity-driven violence prevention strategies.
Data extraction and exploration
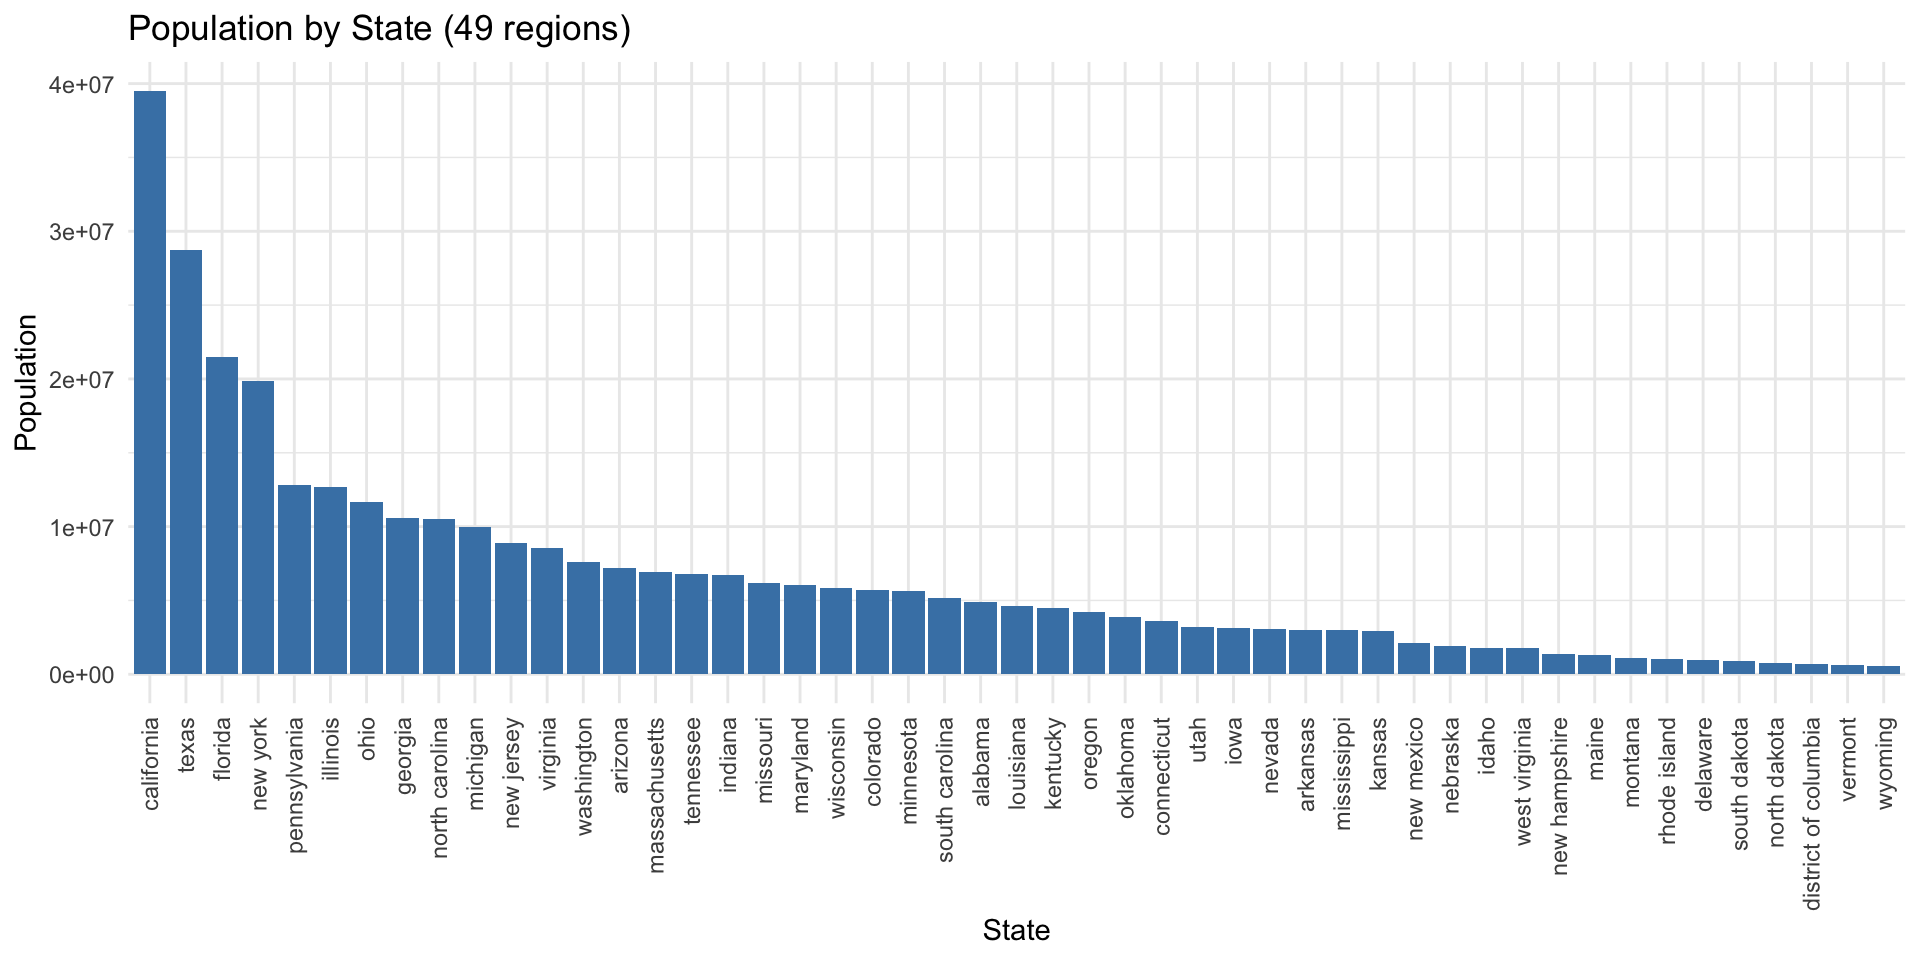
Data include shooting counts and population in 49 states, extracted from gunviolencearchive.org.
Covariates were extracted from data.census.gov and other sites. We searched for state-level covariates that potentially impact shooting incident in the literature.
- Demographic Variables: median age, urbanization percentage.
- Socioeconomic variables: percentage of bachelor/higher degree, poverty, unemployment, income, drug use.
- Gun related-variables: gun policy score.
We also considered gun ownership and alcohol consuming but they are highly correlated with gun policy and drug use, respectively.
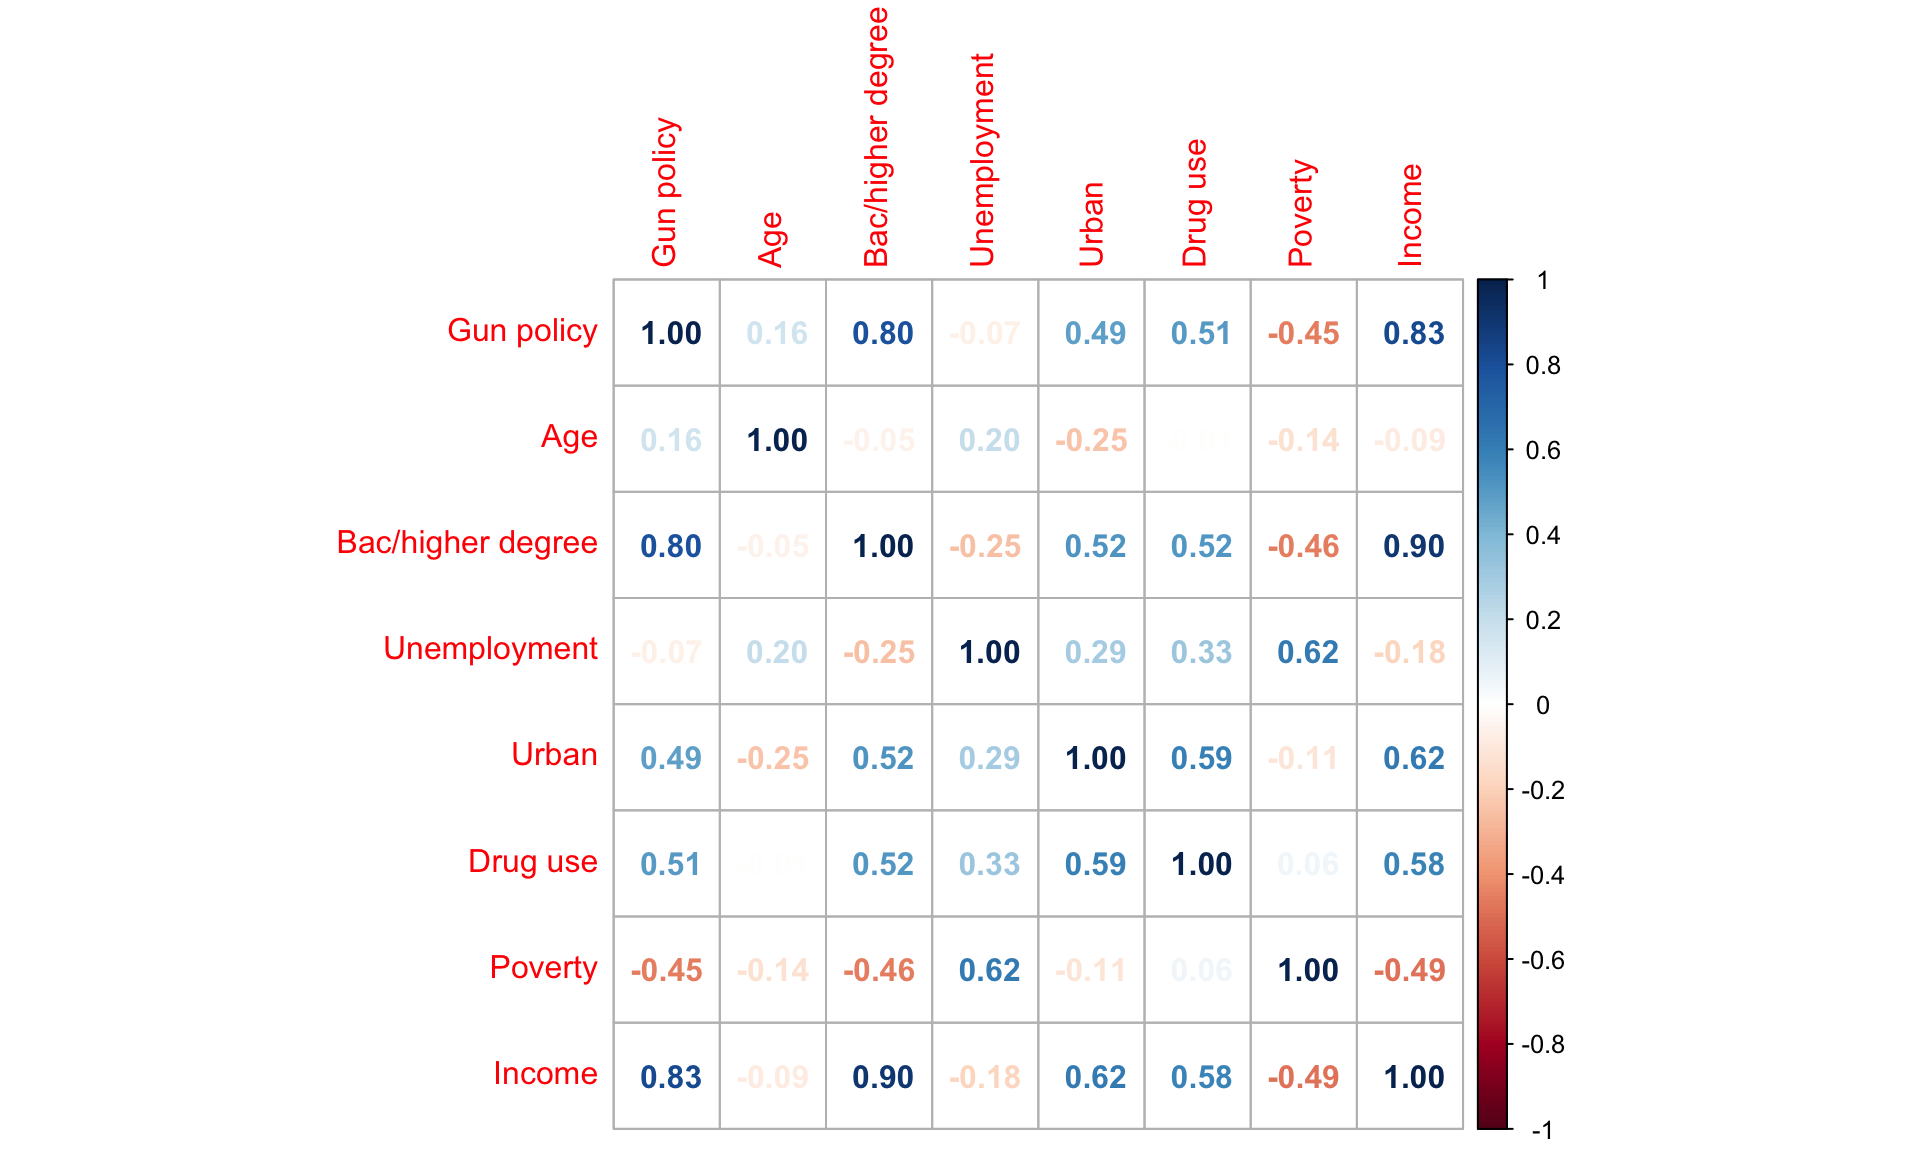
Data extraction and exploration
![]()
- Remove
income due to its high correlation with Bachelor/higher degree and Gun policy.
- Fit Poisson regression with independent residuals using spike-and-slab priors to evaluate the contributions of
gun policy and Bachelor/higher degree.
Data extraction and exploration
We use standardized incidence ratio (SIR) as the population size vary across states.
![]()
Data extraction and exploration
- The map shows that several adjacent states share similarly high or low SIR values.
- These clusters indicate a potential spatial structure—regions with higher-than-expected shooting rates are often neighbouring each other.
- \(\mathrm{SIR} > 1\) indicates the observed cases are higher than expected from the standard population.
Data extraction and exploration
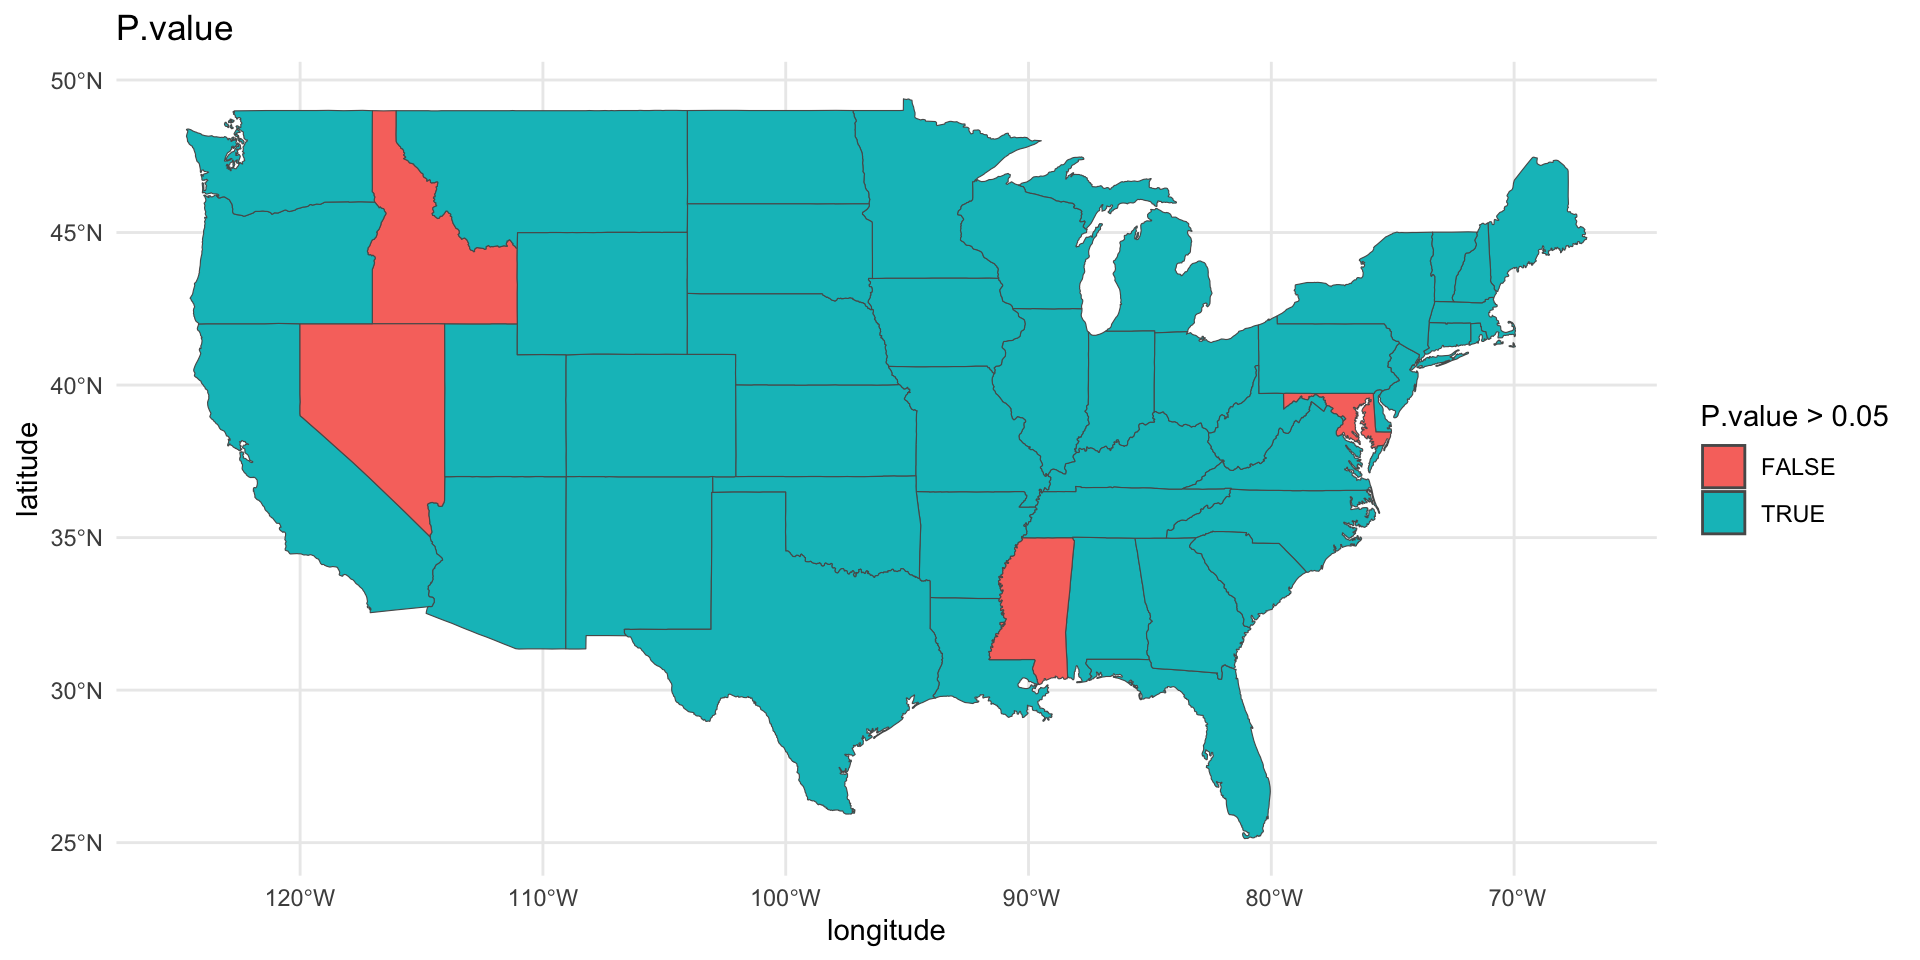
We obtain global and local Moran test to evaluate the spatial structure.
Global test:
| statistic |
0.13 |
| estimate |
-0.02 |
| p.value |
0.02 |
Global and local Moran tests indicate slight spatial autocorrelation, suggesting the need for modelling shooting incident to better reveal and adjust for local spatial dependencies and covariate effects.
Statistical methods - variable selection
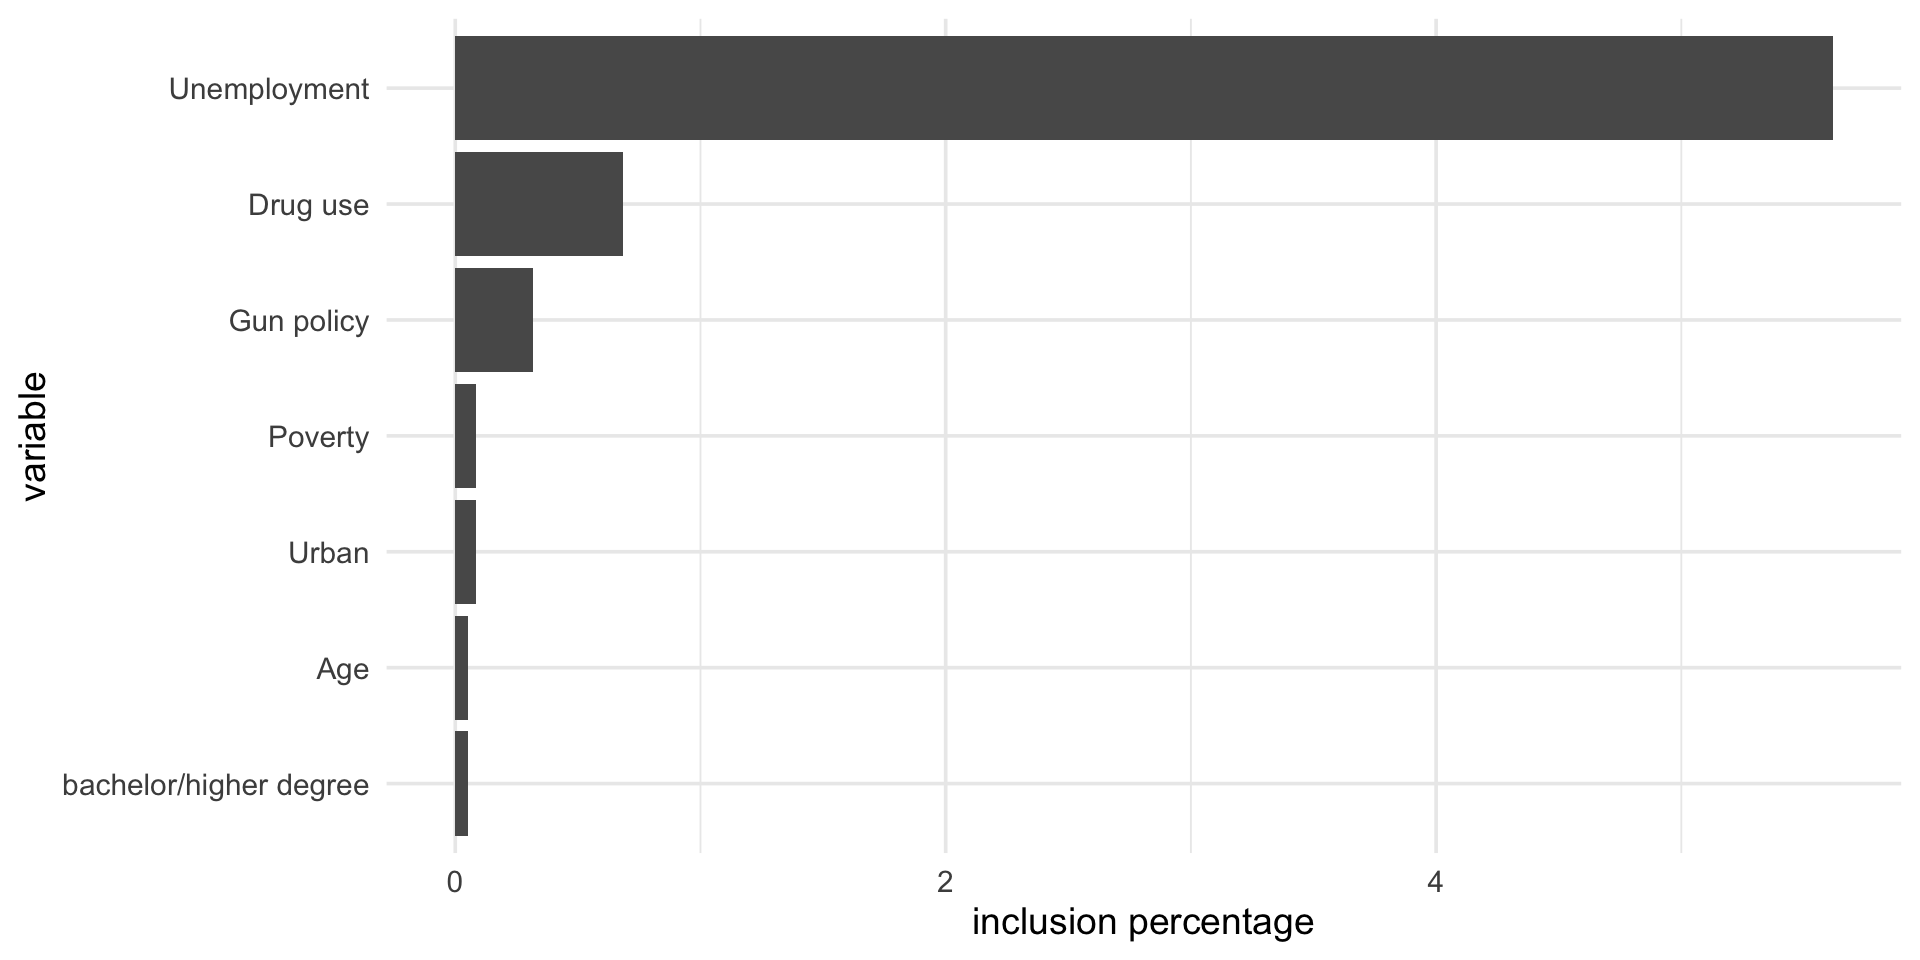
- We fit the Poisson regression using Spike-and-Slab priors.
\[
\begin{aligned}
&y_{i} \sim Pois(E_i\gamma_i)\\
&\ln\gamma_i = \beta_0 + \boldsymbol{x}'_i\boldsymbol{\beta}_1 +\theta_{i}
\end{aligned}
\] Prior distributions:
\[
\begin{aligned}
&\beta_0 \sim N(0,5);\quad \beta_{1j} \sim \delta N(0,5) + (1-\delta)N(0,0.001)\quad \\
&\theta_i\sim N(0,\sigma^2),\quad 1/\sigma^2 \sim \mathrm{Gam}(1, 0.0260), \quad \delta \sim U(0,1)
\end{aligned}
\]
Statistical methods - variable selection
![]()
- We remove
bachelor/higher degree due to its strong correlation with gun policy and minimal contribution to the outcome.
age is also eliminated for its weak contribution.
Statistical methods - models
We fit three models: CAR, BYM and BYM 2 and compare model fitting using WAIC.
BYM 2 model:
\[
\begin{aligned}
&Y_i \sim Pois(E_i\gamma_i); \quad \ln\gamma_i = \beta_0 + \boldsymbol{x}_i'\boldsymbol\beta_1 + \boldsymbol b_i,\\
&\boldsymbol b_i = \sigma(\sqrt{1-\rho}\theta_i + \sqrt\rho\phi_i^*)
\end{aligned}
\]
BYM model:
\[
\ln\gamma_i = \beta_0 + \boldsymbol{x}_i'\boldsymbol\beta_1 + \theta_i + \phi_i
\]
- models assume an additive linear relationship between covariates and the log-risk.
- Also, spatial variation and unstructured noise both exist and are additive.
Statistical methods - models
Prior distributions (BYM 2)
\[
\begin{aligned}
&\beta_0 \sim N(0,5);\quad \beta_{1j} \sim N(0,5); \quad \theta \sim N(0,1) \\
&\sigma \sim N^+(0,1), \quad \rho \sim Beta(.5, .5)
\end{aligned}
\] and \(\phi_i\) is the spatial random effect modelled with intrinsic conditional autoregressive model (CAR) that smooths the data according to a certain neighbourhood structure,
Prior distributions (BYM)
\[
\begin{aligned}
&\beta_0 \sim N(0,5);\quad \beta_{1j} \sim N(0,5); \\
&\theta \sim N(0,\sigma^2_{\theta}); \quad 1/\sigma^2_{\theta} \sim Gam(1, 0.026)\\
&1/\sigma^2_{\phi} \sim Gam(1,1)
\end{aligned}
\]
Model fitting
- All models, including the variable selection model, are fitted using
stan in the R environment.
stan employs full Bayesian inference via Hamiltonian Monte Carlo.- We generate 2000 samples after 4000 warm-up iterations.
- Model convergence is assessed using \(\hat{R}\), with values below 1.1 indicating convergence.
Results - WAIC of three models
| CAR |
421.6 |
| BYM |
420.6 |
| BYM 2 |
421.0 |
From BYM 2, we have
- 95% HDI of \(\rho\) indicates that neighbouring regions exhibit similarity in their outcomes, meaning that spatial clustering is indeed a real feature of the data.
- We select BYM 2 as the primary model, as its WAIC is slightly higher than that of BYM
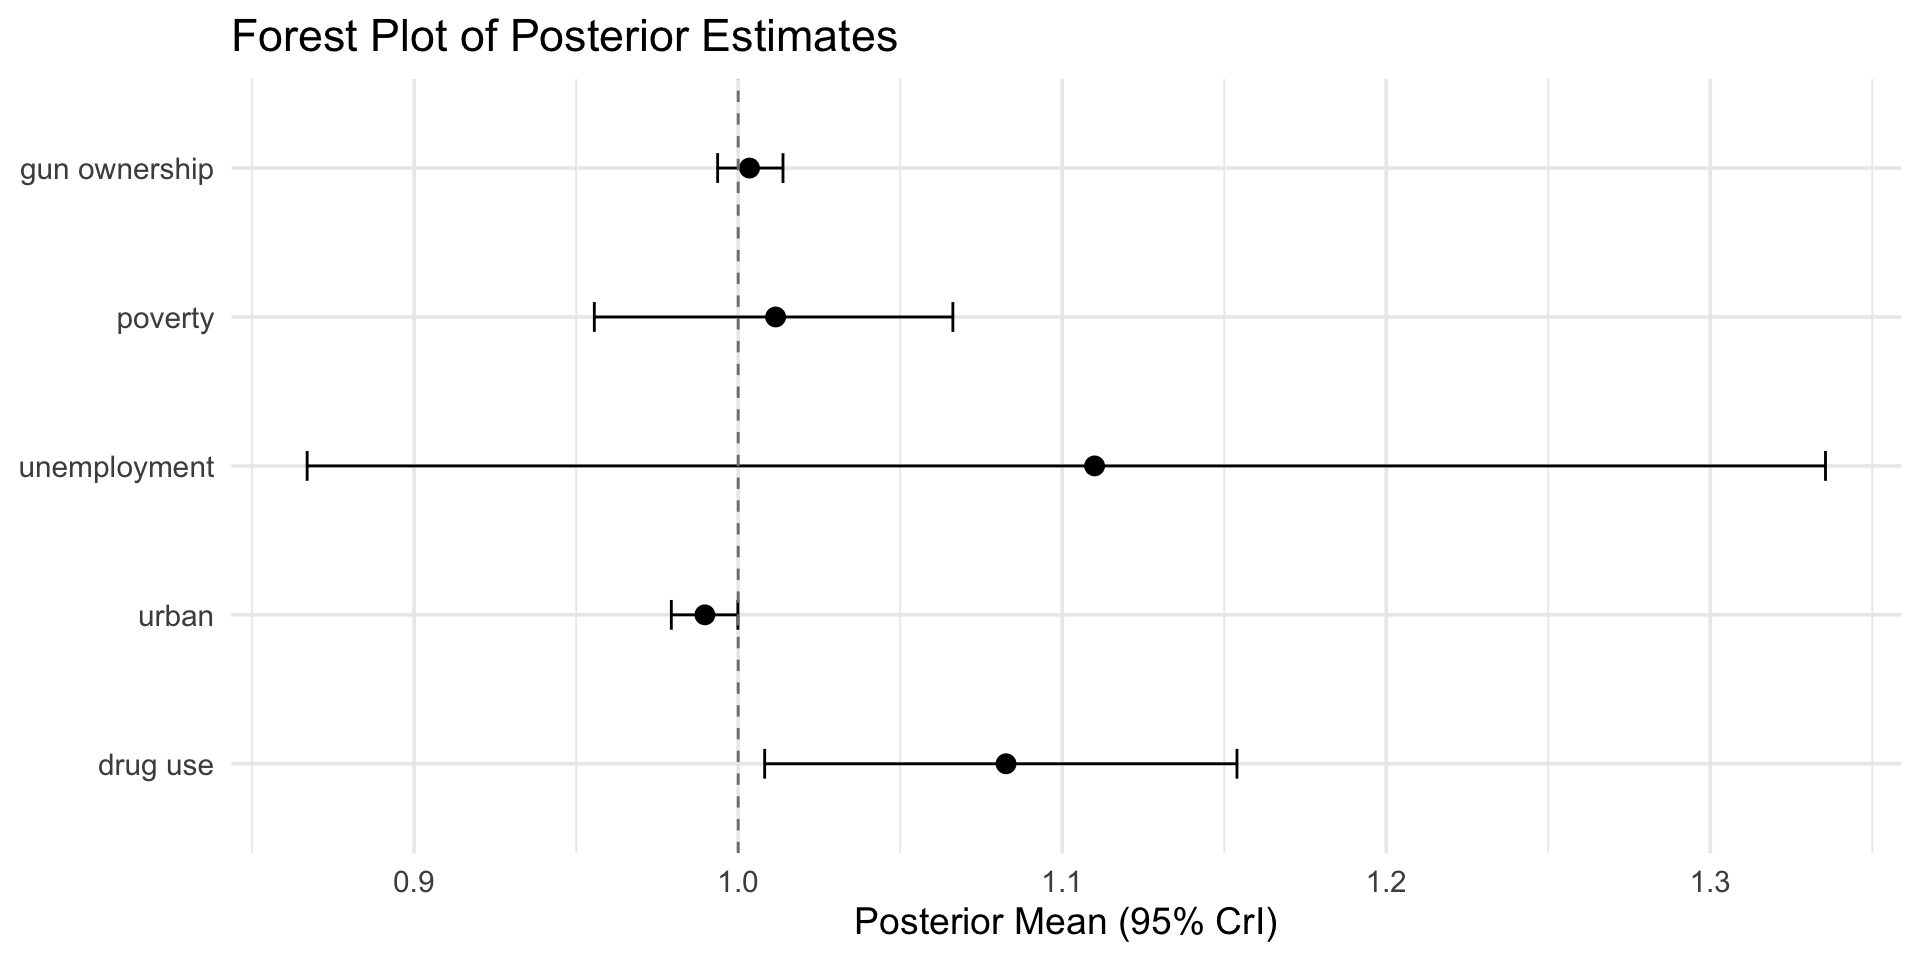
Results - Associated predictors
![]()
- We found evidence that as drug use increases by 1%, the RR increases by 8%, assuming all other covariates are held constant. This is supported by the 95% HDI [1.01, 1.15].
- Although the effect of urbanization is not evident, as indicated by the 95% HDI [0.98, 1], urbanization may have a harmful association with shooting incidents; further investigation is required to confirm this evidence.
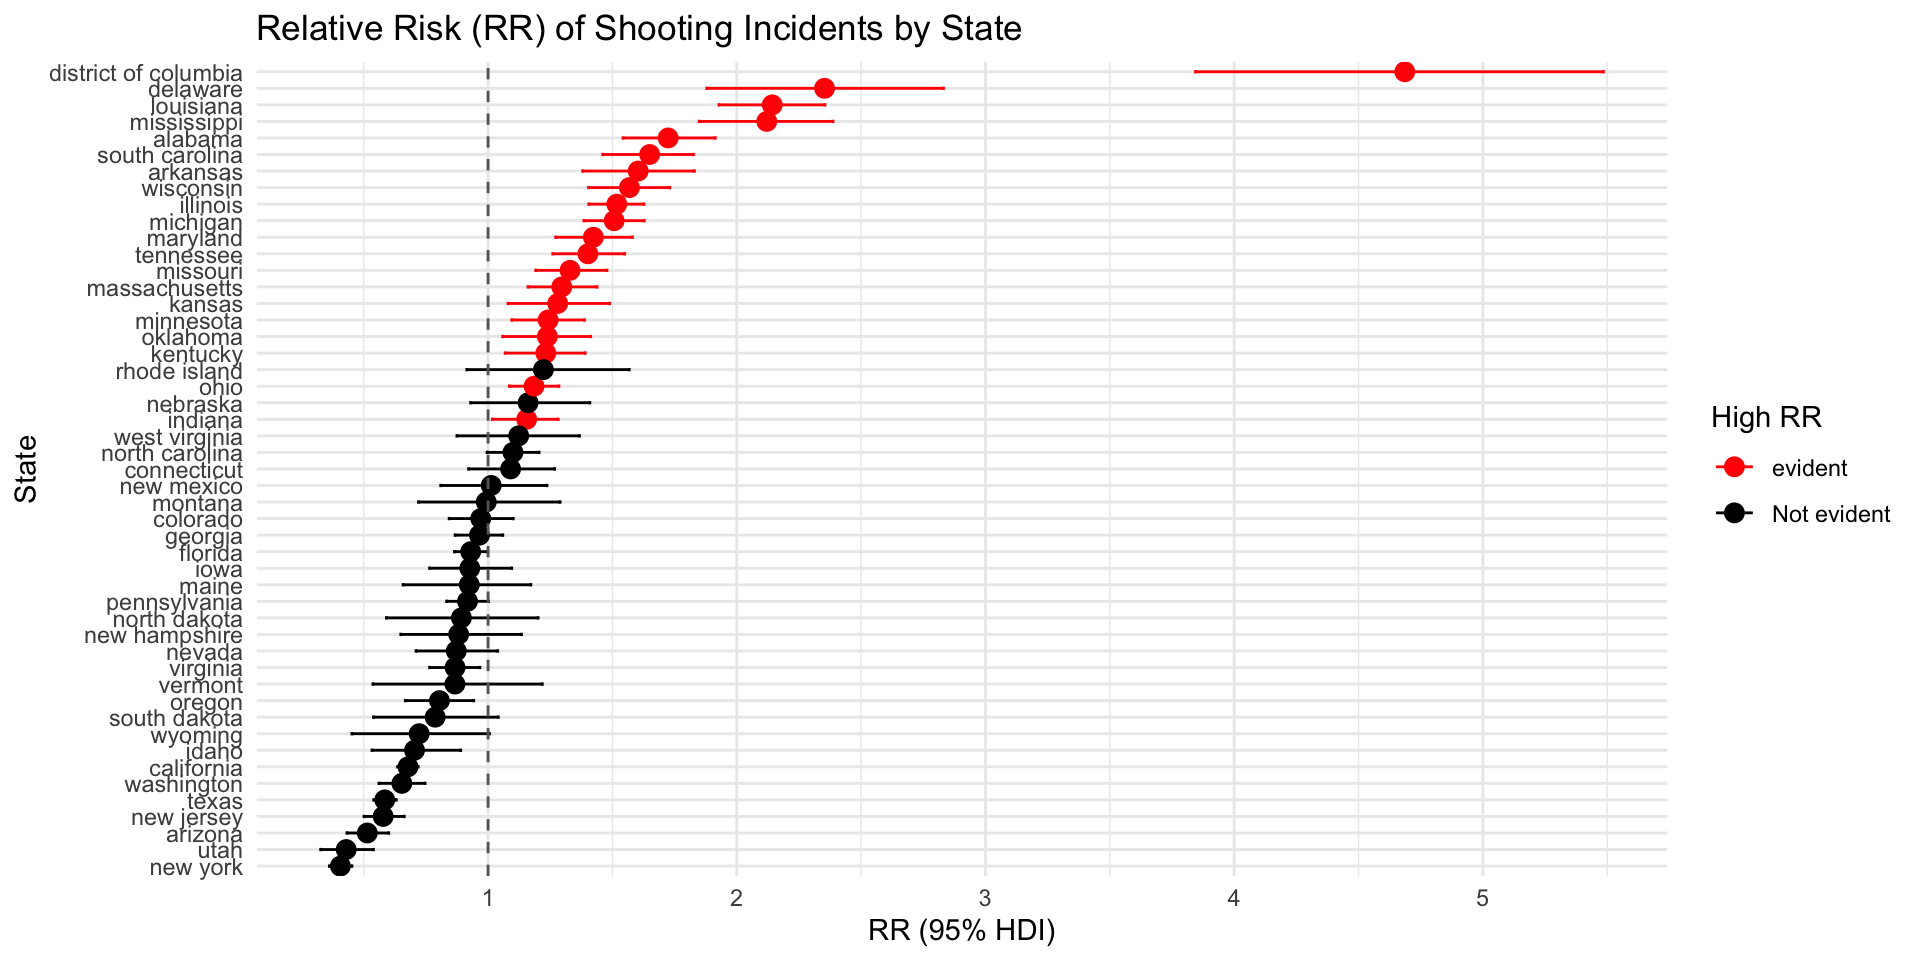
Relative risk of shooting incidents by state
We evaluate the risk of shooting incident relative to the expected baseline.
Relative risk of shooting incidents by state
![]()
Exceedance probabilities
We calculate the probabilities of relative risk being greater than \(1.5\).
Conclusion
- Evidence links drug use to shooting incidents.
- New York has the lowest rate of shootings, while the District of Columbia has the highest.
- Out of 49 states, 20 have rates exceeding expected baselines.
- Alabama, Delaware, District of Columbia, Louisiana, and Mississippi exceed baselines by over 50% with a probability of 1.
- Future studies should consider temporal effects, which allow for describing temporal changes over years.